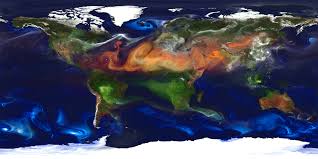
AFRICA: Australian combustion produced Plumes of carbon monoxide that the polluting countries on the other side of the world are making it one of the major providers the long-term trend of growing global temperatures. A new time lapse map released by NASA’s Goddard Space Centre uses data collected during one of Australia’s most extensive bushfire seasons in history to reveal just how far the harmful emissions are felt.
Compressing 12 months of data from 2006 into just minutes, the high resolution computer model shows carbon monoxide emitted by fires in the Victorian Alps and Gippsland being transported by winds to other parts of the world, with the highest concentrations of carbon monoxide and carbon dioxide emissions focused over North America, Europe and Asia.


A large part of these emissions are absorbed by natural land and ocean reservoirs, thus removing some of the gas from the atmosphere – demonstrated in the model as the red and the purple colours start to fade.
But as summer transitions to autumn, and plant photosynthesis decreases, both gases begin to accumulate in the air.
According to the team behind the model, higher concentrations of carbon monoxide and carbon dioxide are recorded each year coinciding with rising global temperatures.